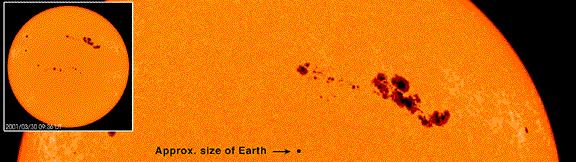
A sunspot is a region on the Sun's surface (photosphere) that is marked by a lower temperature than its surroundings, and intense magnetic activity. Although they are blindingly bright, at temperatures of roughly 5000 K, the contrast with the surrounding material at some 6000 K leaves them clearly visible as dark spots. Interestingly, if they were isolated from the surrounding photosphere they would be brighter than an electric arc.
Sunspot variation
The number of sunspots correlates with the intensity of solar radiation. Since sunspots are dark it is natural to assume that more sunspots means less solar radiation. However the surrounding areas are brighter and the overall effect is that more sunspots means a brighter sun. The variation is small (of the order of 0.1%) and was only established once satellite measurements of solar variation became available in the 1980s.
During the Maunder Minimum there were hardly any sunspots at all and the earth may have cooled by up to 1°C.
History
Apparent references to sunspots were made by Chinese astronomers in 28 BC, who probably could see the largest spot groups when the sun's glare was filtered by wind-borne dust from the various central Asian deserts.
They were first observed telescopically in late 1610 by Frisian astronomers Johannes and David Fabricius, who published a description in June 1611. At the latter time Galileo had been showing sunspots to astronomers in Rome, and Christoph Scheiner had probably been observing the spots for two or three months. The ensuing priority dispute between Galileo and Scheiner, neither of whom knew of the Fabricius' work, was thus as pointless as it was bitter.
Sunspots had some importance in the debate over the nature of the solar system. They showed that the Sun rotated, and their comings and goings showed that the Sun changed, contrary to the teaching of Aristotle. The details of their apparent motion could not be readily explained except in the heliocentric system of Copernicus.
The cyclic variation of the number of sunspots was first observed by Heinrich Schwabe between 1826 and 1843 and led Rudolf Wolf to make systematic observations starting in 1848. The Wolfer number is an expression of individual spots and spot groupings, which has demonstrated success in its correlation to a number of solar observables.
Wolf also studied the historical record in an attempt to establish a database on cyclic variations of the past. He established a cycle database to only 1700, although the technology and techniques for careful solar observations were first available in 1610. Gustav Spörer later suggested a 70-year period before 1716 in which sunspots were rarely observed as the reason for Wolf's inability to extend the cycles into the seventeenth century.
Edward Maunder would later suggest a period over which the Sun had changed modality from a period in which sunspots all but disappeared from the solar surface, followed by the appearance of sunspot cycles starting in 1700. Careful studies revealed the problem not to be a lack of observational data but included references to negative observations. Adding to this understanding of the absence of solar activity cycles were observations of aurorae, which were also absent at the same time. Even the lack of a solar corona during lunar eclipses was noted prior to 1715.
Sunspot research was dormant for much of the 17th and early 18th centuries because of the Maunder Minimum, during which no sunspots were visible for some years; but after the resumption of sunspot activity, Heinrich Schwabe in 1843 reported a periodic change in the number of sunspots.
An extremely powerful flare was emitted toward Earth on 1 September 1859. It interrupted telegraph service and caused visible Aurora Borealis as far south as Havana, Hawaii, and Rome with similar activity in the southern hemisphere.
The most powerful flare observed by satellite instrumentation began on 4 November 2003 at 19:29 UTC, and saturated instruments for 11 minutes. Region 486 has been estimated to have produced an X-ray flux of X28. Holographic and visual observations indicate significant activity continued on the far side of the Sun.
Although the details of sunspot generation are still somewhat a matter of research, it is quite clear that sunspots are the visible counterparts of magnetic flux tubes in the convective zone of the sun that get "wound up" by differential rotation. If the stress on the flux tubes reaches a certain limit, they curl up quite like a rubber band and puncture the sun's surface. At the puncture points convection is inhibited, the energy flux from the sun's interior decreases, and with it the surface temperature. The Wilson effect tells us that sunspots are actually depressions on the sun's surface.
This model is supported by observations using the Zeeman effect that show that prototypical sunspots come in pairs with opposite magnetic polarity. From cycle to cycle, the polarities of leading and trailing (with respect to the solar rotation) sunspots change from north/south to south/north and back. Sunspots usually appear in groups.
The sunspot itself can be divided into two parts :
umbra (temperatures around 2200°C)
penumbra (temperatures around 3000°C)
Magnetic field lines would ordinarily repel each other, causing sunspots to disperse rapidly, but sunspot lifetime is about two weeks. Recent observations from the Solar and Heliospheric Observatory (SOHO) using sound waves travelling through the Sun's photosphere to develop a detailed image of the internal structure below sunspots show that there is a powerful downdraft underneath each sunspot, forming a rotating vortex that concentrates magnetic field lines. Sunspots are self-perpetuating storms, similar in some ways to terrestrial hurricanes.
Sunspot activity cycles about every eleven years. The point of highest sunspot activity during this cycle is known as Solar Maximum (Solar Max for short), and the point of lowest activity is Solar Minimum (Solar Min). At the start of a cycle, sunspots tend to appear in the higher latitudes and then move towards the equator as the cycle approaches maximum: this is called Spörer's law.
Today it is known that there are various periods in the Wolfer number sunspot index, the most prominent of which is at about 11 years in the mean. This period is also observed in most other expressions of solar activity and is deeply linked to a variation in the solar magnetic field that changes polarity with this period, too.
A modern understanding of sunspots starts with George Ellery Hale, in which magnetic fields and sunspots are linked. Hale suggested that the sunspot cycle period is 22 years, covering two polar reversals of the solar magnetic dipole field. Horace W. Babcock later proposed a qualitative model for the dynamics of the solar outer layers. The Babcock Model explains the behavior described by Spörer's law, as well as other effects, as being due to magnetic fields which are twisted by the Sun's rotation.
Application
Sunspots are relatively easily observed -- a small telescope with a projection facility suffices. In some circumstances (low sunsets) sunspots can be observed with the naked eye. Note: Never look directly into the Sun; it can cause permanent, incurable damage to the retina before you know that anything is happening.
Due to their link to other kinds of solar activity, they can be used to predict the space weather and with it the state of the ionosphere. Thus they can help predict conditions of short-wave propagation or satellite communications.
References
Solanki, S.K., I.G. Usoskin, B. Kromer, M. Schussler and J. Beer (2004). "Unusual activity of the Sun during recent decades compared to the previous 11,000 years". Nature 431 (7012): 1084-1087. DOI:10.1038/nature02995 "11,000 Year Sunspot Number Reconstruction". Global Change Master Directory. URL accessed on [[11 March]], 2005.
External links
Belgium World Data Center for the sunspot index
http://www.tvweather.com/awpage/history_of_the_atmosphere.htm
Current conditions: See Space weather
NOAA Solar Cycle Progression: Current solar cycle.
Sunspot data
"11,000 Year Sunspot Number Reconstruction". Global Change Master Directory. URL accessed on 11 March 2005.
"Unusual activity of the Sun during recent decades compared to the previous 11,000 years". WDC for Paleoclimatology. URL accessed on 11 March 2005.
"Sunspot Numbers from Ancient Times to Present from NOAA/NGDC". Global Change Master Directory. URL accessed on 11 March 2005.
"SUNSPOT NUMBERS". NOAA NGDC Solar Data Services. URL accessed on 11 March 2005.
International Sunspot Number -- sunspot maximum and minimum 1610-present; annual numbers 1700-present; monthly numbers 1749-present; daily values 1818-present; and sunspot numbers by north and south hemisphere. The McNish-Lincoln sunspot prediction is also included.
American sunspot numbers 1944-present
Ancient sunspot data 165 BC to 1684 AD
Group Sunspot Numbers (Doug Hoyt re-evaluation) 1610-1995
Retrieved from "http://en.wikipedia.org/wiki/Sunspot"
From Wikipedia, the free encyclopedia.